After a healthy correction in Nifty since Diwali on 5 november, 2010. Everyone is looking for a good entry point in stock markets. Everyone want to know what is the best time to enter into stocks. Is 5500 a bottom or 5300 a bottom for the markets or market will break 5177 levels which Nifty made a low some 2 months back.
If you ask me, Nifty is trading at e PE Multiple of 15 FY12 estimated earnings of 1205 & in the past Nifty average PE Multiple is 15 to 18. Analyzing PE Ratio & technical Analysis, 5177 seems to be bottom for the market & I would request my clients to start accumulate multibagger stocks (60% quantity at 5400 levels & remaining 40% at 5150 levels if comes)
Banking stocks or Bank Nifty has been a clear underperformer & a big support level of 10000. So one needs to accumulate banking stocks at those levels.
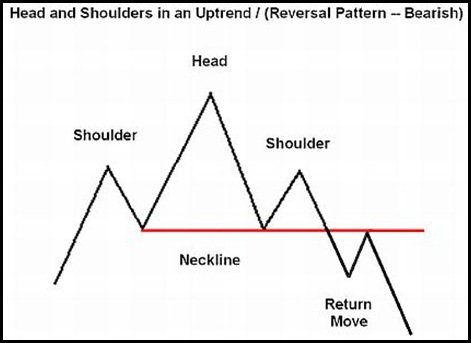
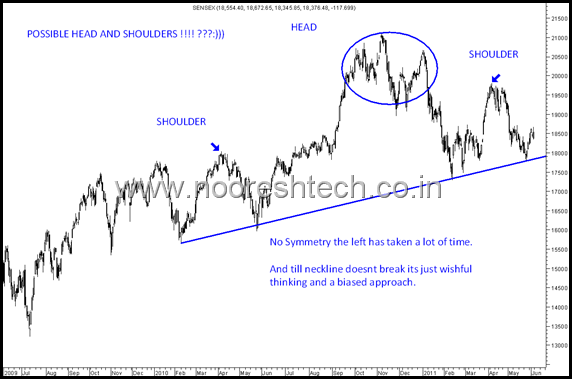
Nifty seems to be forming a head & shoulders pattern which is the most reliable pattern in Technical analysis

Now after explaining you what is a head & shoulder pattern, lets see how this head & shoulder pattern looks on Nifty chart. The chart given below is a 1.5 year old chart of Nifty. Nifty is forming a head 7 shoulder pattern as per indicated in the chart given below

(Source:www.nooreshtech.co.in)
If you want to get some multibagger ideas, you can ask me by putting comments below the article or mailing me at mayankportfoliomanager@yahoo.com. I would be more than happy to discuss multibagger ideas with you.
Regards
Mayank Gupta
mayankportfoliomanager@yahoo.com
If you ask me, Nifty is trading at e PE Multiple of 15 FY12 estimated earnings of 1205 & in the past Nifty average PE Multiple is 15 to 18. Analyzing PE Ratio & technical Analysis, 5177 seems to be bottom for the market & I would request my clients to start accumulate multibagger stocks (60% quantity at 5400 levels & remaining 40% at 5150 levels if comes)
Banking stocks or Bank Nifty has been a clear underperformer & a big support level of 10000. So one needs to accumulate banking stocks at those levels.
Nifty seems to be forming a head & shoulders pattern which is the most reliable pattern in Technical analysis

Now after explaining you what is a head & shoulder pattern, lets see how this head & shoulder pattern looks on Nifty chart. The chart given below is a 1.5 year old chart of Nifty. Nifty is forming a head 7 shoulder pattern as per indicated in the chart given below

(Source:www.nooreshtech.co.in)
If you want to get some multibagger ideas, you can ask me by putting comments below the article or mailing me at mayankportfoliomanager@yahoo.com. I would be more than happy to discuss multibagger ideas with you.
Regards
Mayank Gupta
mayankportfoliomanager@yahoo.com


No comments:
Post a Comment